(Notebooks and other code available at: https://github.com/csdurfee/hot_hand. There's a bunch of stuff in the notebook about the Wald-Wolfowitz test that I will save for another week.)
In my last installment, I was looking at season long shooting records from the NBA, and I concluded that NBA players were less streaky than expected. They have fewer long strings of makes and misses than a series of coin flips would.
I've been thinking this could be due to "heat check" shots -- a player has made a bunch of shots in a row, or are having a good shooting game in general, so they take harder shots than they normally take. It would explain some players that fans consider streaky or "heat check" players who are actually super un-streaky. Jordan Poole was the least streaky player over the last 4 seasons, which defies my expectations. Say he believes he is streaky, so tends to take bad shots when
Or it could be due to "get a bucket" shots -- a player is having a bad shooting game, so they force higher percentage shots and potentially free throws.
There's a quirk of NBA stats to remember: if a player is fouled while shooting, it only counts as a field goal attempt if they make the shot. So driving to the hoop is guaranteed to not decrease a player's field goal percentage if they successfully draw a foul, or get called for an offensive foul.
I'm not sure I've made an airtight case for the lukewarm hand. Combining every game in a season could hide the hot hand effect. What about individual games?
Game-level shooting statistics show a lukewarm tendency
I am using the complete shooting statistics available from this kaggle project: https://www.kaggle.com/datasets/mexwell/nba-shots
I'm looking at the 2023-2024 season, since the current season isn't included yet.
I went through every game that every player played in the NBA season and calculated the expected vs. actual number of streaks.
There are 24,895 player+game combos. 10,285 of them had more streaks than expected against 8,977 who had fewer streaks than expected (and around 5,000 that are exactly as expected). This is a significant imbalance towards the "lukewarm hand" side.
Here's the histogram of individual game z-scores:
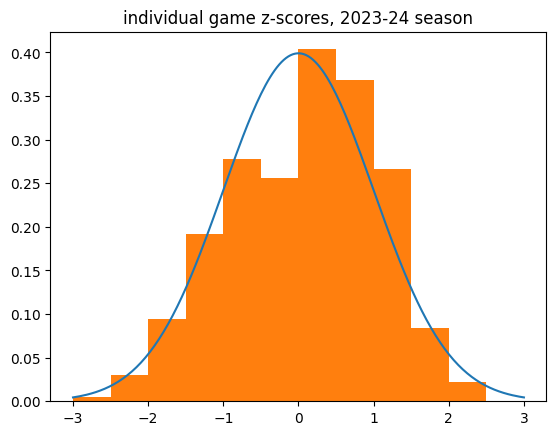
And the breakdown:
count    18982.000000
mean         0.051765
std          0.988789
min         -3.332292
25%         -0.707107
50%          0.104103
75%          0.816497
max          3.583243
Name: z_score, dtype: float64
Limiting to higher volume games (at least 10 makes or 10 misses) shows the same tendency.
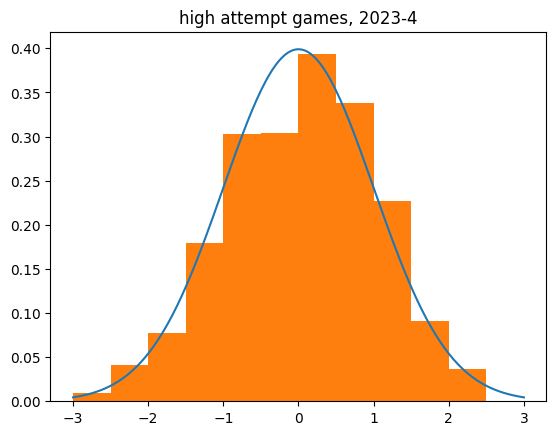
count    2536.000000
mean        0.055925
std         1.010195
min        -3.079575
25%        -0.616678
50%         0.072404
75%         0.750366
max         3.583243
Name: z_score, dtype: float64
There definitely appears to be a bias towards the lukewarm hand in individual game data. The mean z scores aren't that much bigger than zero, but it's a huge sample size.
Simulating streaky and non-streaky players
I coded up a simulation of a non-streaky player. When they have hit a minimum number of attempts in the game, if their shooting percentage goes above a certain level, they get a penalty. If it goes below a certain level, they get a boost.
I was able to create results that look like NBA players in aggregate with an extremely simplified model. The parameters were arbitrarily chosen
By default, the thresholds are 20% and 80%, and the boost/penalty is 20%. So a 50% shooter who has taken at least 4 shots and is shooting 80% or better for the game will get their FG% knocked down to 30% till their game percentage drops below the threshold. Likewise if they hit 20% or less, they get a boost until they're over the threshold.
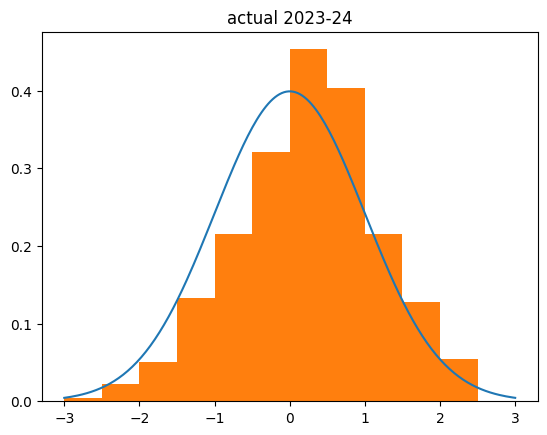
I used the game level shooting statistics I got for the individual game-by-game analysis. I then replayed every shot in the NBA in the 2023-24 season using the simulated lukewarm player (and the actual fg% and number of shots attempted in each game). This is what I got:

count    526.000000
mean       0.218032
std        0.965737
min       -2.397958
25%       -0.491051
50%        0.241554
75%        0.836839
max        3.787951
Name: z_score, dtype: float64
My simulation was actually less biased to the right than the actual results:
Several big things to note:
- I simulated every player in the league as being a little un-streaky.
- I simulated them being un-streaky in both directions
- The boost/penalty are pretty big -- going from 50% FG percentage to 30% is going from a good NBA player to a bad college player level, and the boost to 70% FG percentage has no precedent. The most accurate shooters in the NBA are usually big men who only shoot dunks and layups, and they still usually end up in the 60-65% range.
Which is to say, my simulation is kind of silly and seemingly over-exaggerated. And it's still not as lukewarm as real NBA players are. Wild, isn't it?
Streakiness in only one direction
I also simulated players who were only streaky in one direction: "get a bucket" players who get a boost to shooting percentage when they are shooting poorly, but no penalty when they are doing well, and "heat check" players who only get the penalty.
The results were biased to the unstreaky side, but about half as much as the ones that are streaky in both directions. I had to crank the penalties/boosts up to unrealistic levels to get the bias of the z-scores up to the .2-.3 range I'm seeing with real season-level data.
The truly streaky player
Of course, I had to simulate the hot hand. The TrulyStreakyPlayer is the exact opposite of the LukewarmPlayer. They get a 20% boost when they're shooting well on the game, and a 20% penalty when they're shooting poorly.
What stands out to me here is how much it affects the z-score. I was expecting the z-scores to be biased to the negative side by about as much as the unstreaky player was to the positive side. But the effect was a lot more dramatic:
count    524.000000
mean      -0.455522
std        1.144570
min       -4.413268
25%       -1.225128
50%       -0.458503
75%        0.404549
max        2.486584
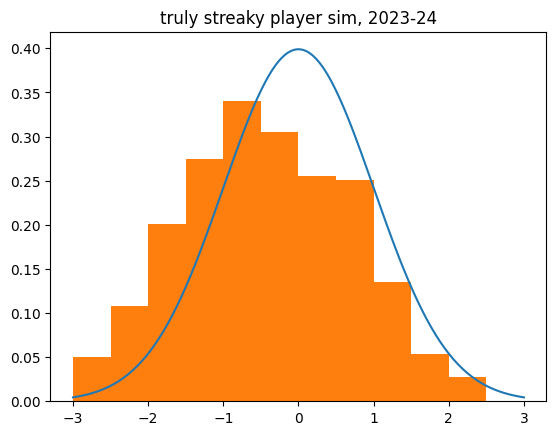
Unlike the un-streaky simulations, the streaky behavior increased the dispersion (std), like we saw with the real shot data. There are many more outliers to the negative side than we'd expect.
What next?
I could certainly sim a mixture of streaky and unstreaky players, and eventually maybe get something that matches the real numbers pretty closely. But there are so many parameters to fit that it would be pretty arbitrary. Someone else could produce a different model that works just as well.
Most importantly, it couldn't tell us which players might be streaky due to chance versus streaky due to behavior/shot selection. So I think the next step is looking at the shot selection in the "hot hand" vs. "get a bucket" situations -- do players switch to higher percentage shots when they're having a bad game, and worse shots when they're shooting better than usual?